
Here’s a full description of the chart based on the historical graph and modern real wage growth data for China:
📈 Chart Title:
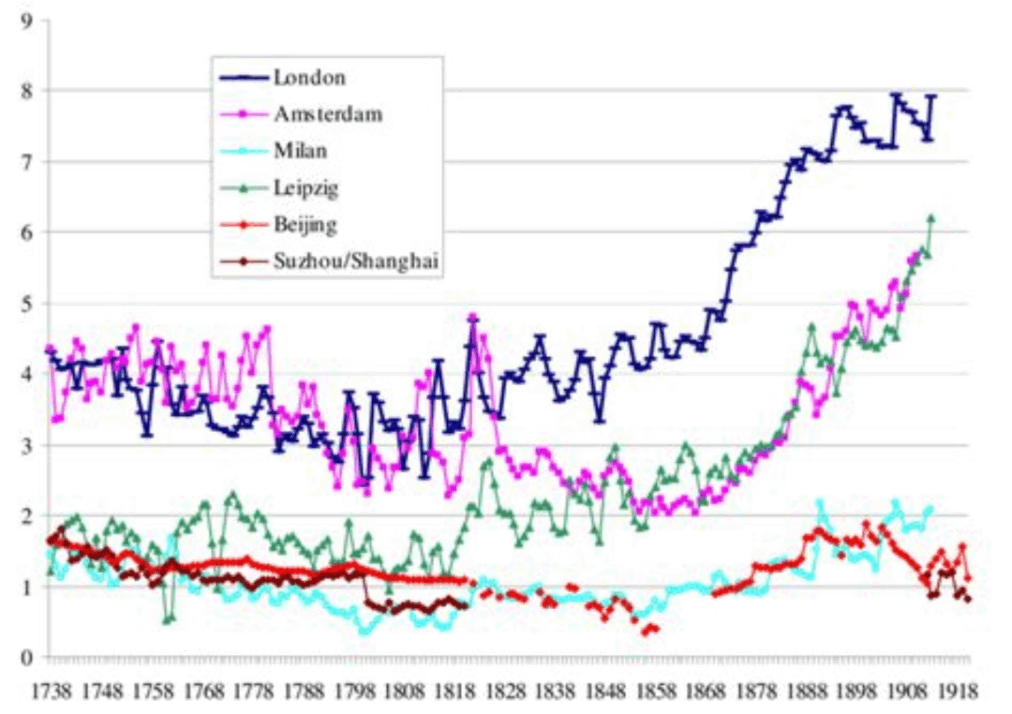
China’s Growth in Real Livable Wages: 1738–2023
🗂️ Chart Description:
This chart visualizes the evolution of real wages in China over nearly three centuries. It compares historical wage levels in major cities like Beijing and Suzhou/Shanghai to European cities. It also shows the post-1978 economic boom through China’s official real wage index.
🧭 X-Axis (Time Period):
1738 to 2023 (year intervals)
💴 Y-Axis (Real Wage Index / Comparative Units):
- For historical periods: Indexed real wages (based on daily laborer purchasing power, benchmarked to a European basket of goods).
- For modern period (post-1978): Real Wage Index (1978 = 100).
🕰️ Historical Segment (1738–1924):
Data from Historical Sources:
- Beijing:
- 1738–1788: Hovered around 35 (very low purchasing power compared to Europe)
- 1820s–1870s: Dropped slightly below 30
- 1900–1924: Remained stagnant, hovering around 30
- Suzhou/Shanghai:
- 1738–1788: Roughly 45–50
- Gradual decline through 19th century, down to 35–40 by 1900
- 1924: Around 40
- Comparison (Europe):
- London (for reference): ~180+ during same period
- Amsterdam & Leipzig: 100–150 depending on the decade
📌 Insight: For more than two centuries, real wages in China were below their European counterparts. This trend highlighted a long-standing gap in living standards.
🚀 Modern Segment (1978–2023):
Urban Real Wage Index (CEIC Data):
- 1978: Index starts at 100 (reform era begins)
- 2000: ~500
- 2010: ~1,200
- 2020: ~2,200
- 2023: 2,593
That’s a 25x increase in real wages since the beginning of market reforms.
Per Capita Disposable Income (National Bureau of Statistics of China):
- 2023 (urban): ¥51,821 (~$7,170 USD)
- 2024 (national): ¥41,314 (~$5,734 USD)
- Median income: ¥34,707 (~$4,817 USD)
- Real income growth: +4.8% (2023)
📌 Insight: Since 1978, China’s real wages have skyrocketed. This reflects not just economic growth but also improved living standards. It also shows increased consumption power, and better access to goods and services.
🔍 Key Takeaway:
The chart reveals two eras of Chinese wage history:
- A long period of stagnation and poverty relative to the West (pre-20th century),
- Followed by a historic wage boom starting in the late 20th century, driven by industrialization, urbanization, and economic reform.